Just because we cannot imagine a future does not mean it cannot happen
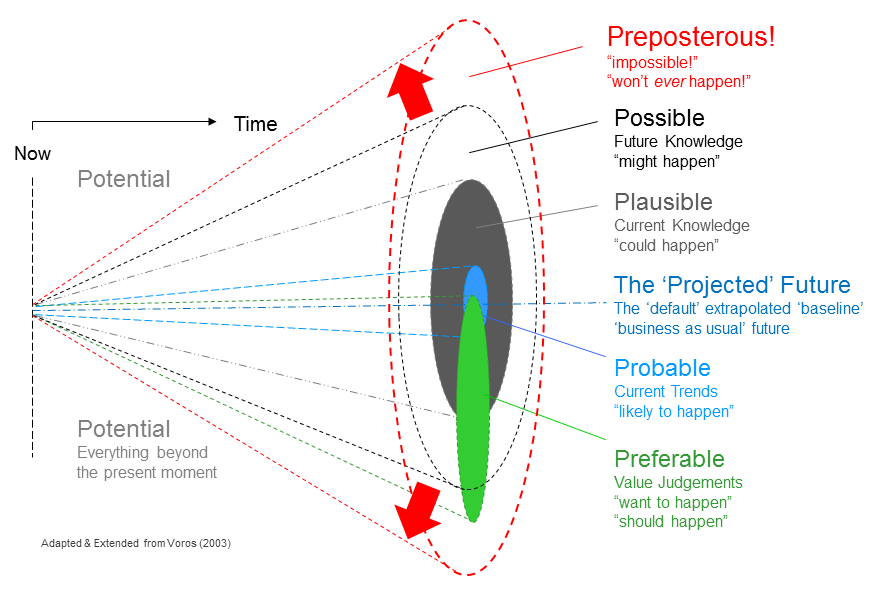
I came across this post yesterday in which I was interested primarily for the graphic. The author didn’t specifically acknowledge the source, but I found Joseph Voros' blog in which he explains how he came up with what he calls The Futures Cone:
The above descriptions are best considered not as rigidly-separate categories, but rather as nested sets or nested classes of futures, with the progression down through the list moving from the broadest towards more narrow classes, ultimately to a class of one — the ‘projected’. Thus, every future is a potential future, including those we cannot even imagine — these latter are outside the cone, in the ‘dark’ area, as it were. The cone metaphor can be likened to a spotlight or car headlight: bright in the centre and diffusing to darkness at the edge — a nice visual metaphor of the extent of our futures ‘vision’, so to speak. There is a key lesson to the listener when using this metaphor—just because we cannot imagine a future does not mean it cannot happen…
Source: The Voroscope